Figure 3
Evaluation of Desmin, α-SMA and hTERT expression in pulmonary fibrosis and lung cancer
Farahnaz Fallahian*, Seyed Ali Javad Moosavi, Frouzandeh Mahjoubi, Samira Shabani, Pegah Babaheidarian and Tayebeh Majidzadeh
Published: 23 January, 2018 | Volume 3 - Issue 1 | Pages: 001-009
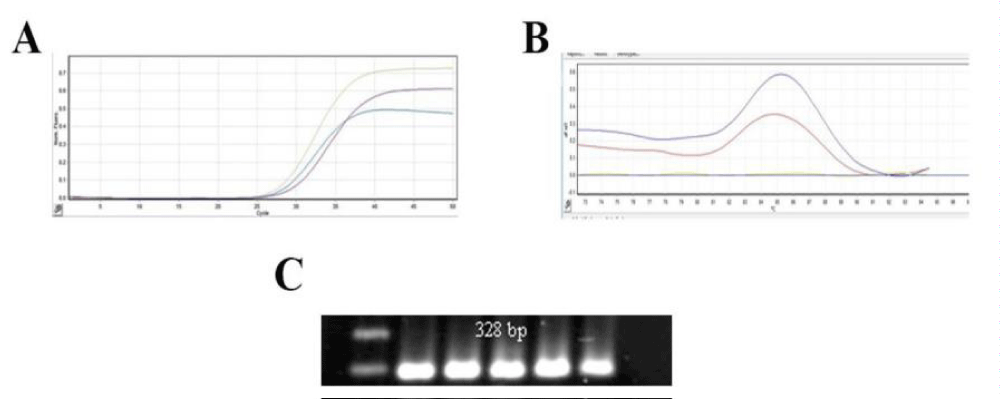
Figure 3:
The amplification curves, melting curve and PCR products of hTERT based on Real Time RT PCR in Parafin-embedded lung cancer tissue blocks. A) Amplification curves, of hTERT, B) melting curves of hTERT and C) expression of hTERT by electrophoresis of PCR products that showed only one band of the expected size.
Read Full Article HTML DOI: 10.29328/journal.jcicm.1001011 Cite this Article Read Full Article PDF
More Images
Similar Articles
-
Evaluation of Desmin, α-SMA and hTERT expression in pulmonary fibrosis and lung cancerFarahnaz Fallahian*,Seyed Ali Javad Moosavi,Frouzandeh Mahjoubi,Samira Shabani,Pegah Babaheidarian,Tayebeh Majidzadeh. Evaluation of Desmin, α-SMA and hTERT expression in pulmonary fibrosis and lung cancer. . 2018 doi: 10.29328/journal.jcicm.1001011; 3: 001-009
Recently Viewed
-
Exploring the Potential of Medicinal Plants in Bone Marrow Regeneration and Hematopoietic Stem Cell TherapyUgwu Okechukwu Paul-Chima*,Alum Esther Ugo. Exploring the Potential of Medicinal Plants in Bone Marrow Regeneration and Hematopoietic Stem Cell Therapy. Int J Bone Marrow Res. 2025: doi: 10.29328/journal.ijbmr.1001019; 8: 001-005
-
Deep Learning-Powered Genetic Insights for Elite Swimming Performance: Integrating DNA Markers, Physiological Biometrics and Performance AnalyticsRahul Kathuria,Reeta Devi,Asadi Srinivasulu*. Deep Learning-Powered Genetic Insights for Elite Swimming Performance: Integrating DNA Markers, Physiological Biometrics and Performance Analytics. Int J Bone Marrow Res. 2025: doi: 10.29328/journal.ijbmr.1001020; 8: 006-015
-
The Impact of Forensic Science on the Legal System in IndiaSrishti*. The Impact of Forensic Science on the Legal System in India. J Forensic Sci Res. 2025: doi: 10.29328/journal.jfsr.1001072; 9: 001-006
-
Forensic Psychology and Criminal ProfilingEze SM*,Alabi KJ,Yusuf AO,Hamzat FO,A Abdulrauf,Atoyebi AT,Lawal IA,OA Ibrahim,AY Imam-Fulani,Dare BJ. Forensic Psychology and Criminal Profiling. J Forensic Sci Res. 2025: doi: 10.29328/journal.jfsr.1001085; 9: 092-096
-
Architectural Design of Geothermal Plants for Electricity GenerationJorge Pablo Aguilar Zavaleta*. Architectural Design of Geothermal Plants for Electricity Generation. Ann Civil Environ Eng. 2025: doi: 10.29328/journal.acee.1001078; 9: 045-050
Most Viewed
-
Feasibility study of magnetic sensing for detecting single-neuron action potentialsDenis Tonini,Kai Wu,Renata Saha,Jian-Ping Wang*. Feasibility study of magnetic sensing for detecting single-neuron action potentials. Ann Biomed Sci Eng. 2022 doi: 10.29328/journal.abse.1001018; 6: 019-029
-
Evaluation of In vitro and Ex vivo Models for Studying the Effectiveness of Vaginal Drug Systems in Controlling Microbe Infections: A Systematic ReviewMohammad Hossein Karami*, Majid Abdouss*, Mandana Karami. Evaluation of In vitro and Ex vivo Models for Studying the Effectiveness of Vaginal Drug Systems in Controlling Microbe Infections: A Systematic Review. Clin J Obstet Gynecol. 2023 doi: 10.29328/journal.cjog.1001151; 6: 201-215
-
Prospective Coronavirus Liver Effects: Available KnowledgeAvishek Mandal*. Prospective Coronavirus Liver Effects: Available Knowledge. Ann Clin Gastroenterol Hepatol. 2023 doi: 10.29328/journal.acgh.1001039; 7: 001-010
-
Causal Link between Human Blood Metabolites and Asthma: An Investigation Using Mendelian RandomizationYong-Qing Zhu, Xiao-Yan Meng, Jing-Hua Yang*. Causal Link between Human Blood Metabolites and Asthma: An Investigation Using Mendelian Randomization. Arch Asthma Allergy Immunol. 2023 doi: 10.29328/journal.aaai.1001032; 7: 012-022
-
An algorithm to safely manage oral food challenge in an office-based setting for children with multiple food allergiesNathalie Cottel,Aïcha Dieme,Véronique Orcel,Yannick Chantran,Mélisande Bourgoin-Heck,Jocelyne Just. An algorithm to safely manage oral food challenge in an office-based setting for children with multiple food allergies. Arch Asthma Allergy Immunol. 2021 doi: 10.29328/journal.aaai.1001027; 5: 030-037

HSPI: We're glad you're here. Please click "create a new Query" if you are a new visitor to our website and need further information from us.
If you are already a member of our network and need to keep track of any developments regarding a question you have already submitted, click "take me to my Query."


